EnergyVis | CityVis 2020
This EnergyVis workshop series originated as a Workshop on Urban Visualization specifically focusing on Energy Resilient Cities. This was held in June 2020 in conjunction with the ACM e-Energy 2020, Melbourne, Australia (virtual). This workshop was the 3rd in the CityVis Workshop series.
Energy Resilient Cities was seen to be an important topic for focus for this first domain-focused Urban Visualization workshop. The energy sector is seeing substantial technological and analytical enhancements enabling the delivery of smart systems via sensors, monitors and other digital technologies as well as improvements to predictions, forecasts and models throughout the industry. This emerging data is not only growing in volume, but in its complexity. This complexity increases as we draw connections with other urban infrastructures and incorporate populations.
Visualization and visual analytics offer a vast array of opportunities for the energy domain and we are now seeing a new era of ‘Energy Data Visualization’ emerging as a key topic of growing importance. The workshop in 2020 aimed to bring together scientists, researchers and practitioners from the energy field to discuss the many challenges and goals in regard to Urban Data Visualization, with a specific focus on Energy Resilient Cities
The identified challenges, goals and insights from the first three CityVis workshop series (including the EnergyVis workshop) are available to read in the recently published paper:
S. Goodwin, S. Meier, L. Bartram, A. Godwin, T. Nagel and M. Dörk, "Unravelling the Human Perspective and Considerations for Urban Data Visualization," 2021 IEEE 14th Pacific Visualization Symposium (PacificVis), 2021, pp. 126-130, doi: 10.1109/PacificVis52677.2021.00024.
For further information on the workshop series see the CityVis Workshop website.9:00-10:00 Introduction and Accepted Paper Presentations
Session Chair: Barrett Ens (Workshop Chair)The Conception of an Urban Energy Dashboard using 3D City Models, Patrick Würstle, Thunyathep Santhanavanich, Rushikesh Padsala, Volker Coors - Hochschule für Technik Stuttgart. https://doi.org/10.1145/3396851.3402650
Illuminating energy: Smart Lights, Householders and Intuitive Energy Data Visualization, Rex Martin - Monash University. https://doi.org/10.1145/3396851.3402649
Want to Reduce Energy Consumption, Which Floor Should I Prefer? Priyanka Mary Mammen, Surabhi Mehrotra, Hareesh Kumar, Krithivasan Ramamritham - IITB Bombay. https://doi.org/10.1145/3396851.3402648
Toward Improving Building User Energy Awareness, Yidan Zhang, Arnaud Prouzeau, Hourieh Khalajzadeh, Sarah Goodwin - Monash University. https://doi.org/10.1145/3396851.3402647
> Watch the Paper Presentation Recording
10:00-11:00 Invited Speaker Presentations and Panel Discussion
Session Chair: Sarah Goodwin (Workshop Chair)Kenny Gruchalla, Senior Scientist, National Renewable Energy Laboratory (NREL), Denver, USA
Jagoda Walny, Technical Lead, Visual Design Team, Canada Energy Regulator, Calgary, Canada
Lyn Bartram, Professor in the School of Interactive Art and Technology and Director of the Vancouver Institute of Visual Analytics, Simon Fraser University, BC, Canada
Yolande Strengers, Associate Professor, Emerging Technologies Research Lab, Faculty of Information Technology, Monash University, Melbourne, Australia
> Watch the Invited Speaker Presentation Recording
> Watch the Invited Speaker Panel Recording
11:15-13:00 Interactive Brainstorming and Workshop Wrap Up
Session Facilitator: Sarah Goodwin (Workshop Chair)For the 2nd half of the workshop was spent exploring the challenges (pink post-it notes) and goals (yellow post-it notes) in regard to Urban Data Visualization, with a specific focus on Energy Resilient Cities:
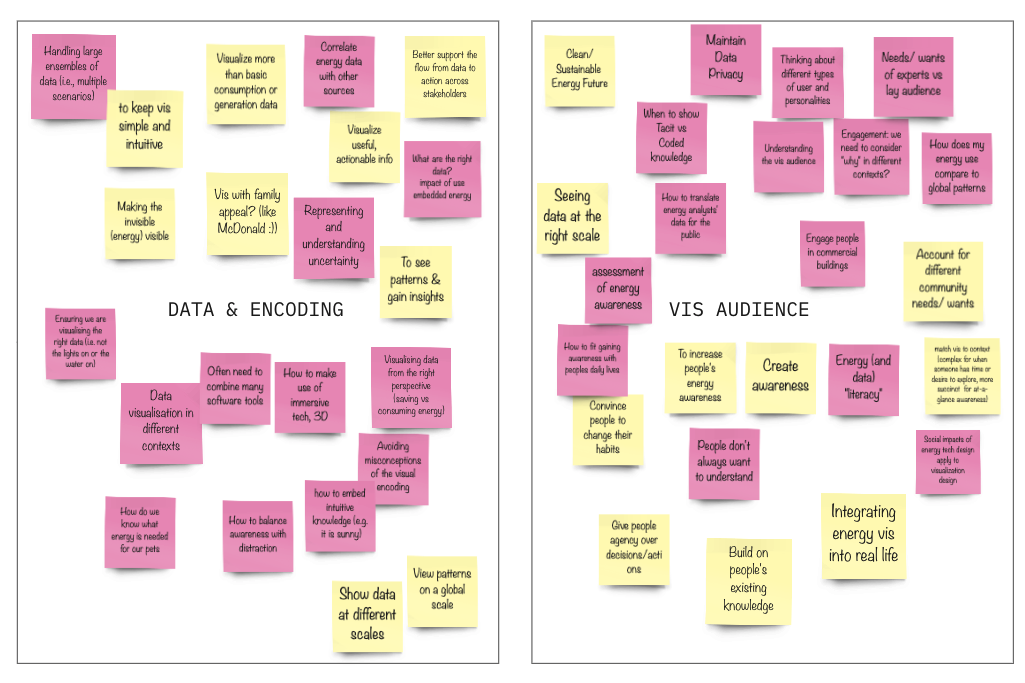
After individual brainstroming of the challenges (pink post-it notes) and goals (yellow post-it notes) in the field, we looked for similarities and began to group together into common themes
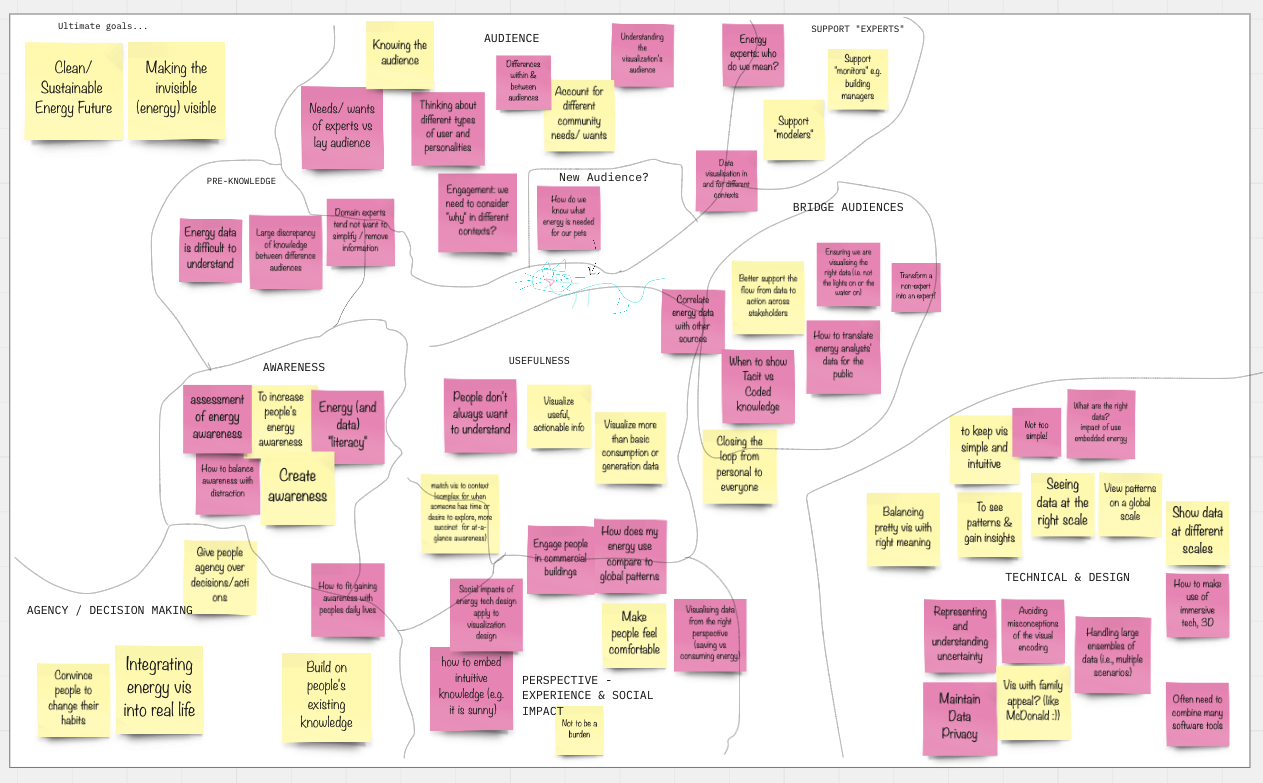
These initial themes and brainstorming will form input into the discussion for EnergyVis 2021.
> Watch an overview of completed interactive brainstroming session
- Sarah Goodwin Monash University, Australia
- Arnaud Prouzeau Monash University, Australia
- Barrett Ens Monash University, Australia
- Kody Anh Nguyen Monash University, Australia
- Hala Almukhalfi Monash University
- Lyn Bartram Simon Fraser University
- Susanne Bleisch FHNW Northwestern Switzerland
- Pari Delir Haghighi Monash University
- Johanna Fulda Clir Renewables Inc
- Alex Godwin American University, Washington D.C.
- Kenny Gruchalla National Renewable Energy Laboratory
- Maria Jesus Lobo Ecole Nationale de l'Aviation Civile
- Sebastian Meier Hafencity University
- Juan Francisco Saldarriaga Columbia University
- Darren Sharp Monash University
- Yolande Strengers Monash University
- Cagatay Turkay University of Warwick
- Wesley Willet University of Calgary
