EnergyVis
In conjunction with ACM e-Energy 2021, Torino, Italy (virtual)
Recent years have seen substantial technological and analytical enhancements to the energy sector, enabling the move away from a passive and inefficient power grid network to the delivery of a smart system via sensors, monitors and other digital technologies. In parallel, we have seen advanced data analytics emerging (and being presented at core venues such as e-Energy) to explore improvements to predictions, forecasts and models throughout the industry. The emerging data from this sector is not only growing in volume but in its complexity.
Visualization as a tool for data analysis, exploration and communication has become a driving force in the task of unravelling data complexity and is crucial in helping to bridge the gap between the flood of data and ensuring decision makers can make more effective and informed decisions. Visualization and visual analytics offer a vast array of opportunities for the energy domain and we have seen a new era of ‘Energy Data Visualization’ emerge as a topic of growing importance.
This workshop brings together scientists, researchers and practitioners from the field to discuss the many challenges and goals in regard to energy data visualization. This topic will build on the findings of the first workshop.
Following from the success of 2020, the fully virtual event will involve short paper talks, demos, and interactive group brainstorming to discuss the goals and challenges of the field. We encourage all participants to remain for the full workshop.
The workshop will commence at 1PM CEST, and run for 3-4 hours (full details will be made available when the program is published). This start time has been chosen to fit as many world timezones as possible (convert to other timezones), participant locations as well as take into account the 'location' of the conference.
Every fully accepted paper must be linked to a full 'Conference + Workshop' registration using either the ACM Member (USD$100) or Non-Member rate (USD$125) (student registration does not cover workshop papers). For all other workshop participants attendance to the workshop is free. Registration is required to access the virtual link. Registration is available via the e-energy conference website.
Please contact one of the workshop chairs below if you have any further questions.
We are interested in bringing together multidisciplinary perspectives, especially on the human-centric component of energy visualizations. We invite innovative ideas, design concepts, requirement analysis and work-in-progress relating to the following technical scope:
- Energy visualization contexts smart cities/homes/buildings/grid, network visualizations, energy policy and governance, net zero initiatives, energy consumers and analysis, energy markets, microgrids/nanogrids
- Energy visualization challenges uncertainty visualization, spatio-temporal visualization, large network visualization, micro/macro scale, automated model comprehension
- Disruptive technologies open source, open analytics and open workflows, machine learning, AI, VR/XR, tangible interfaces,
- Data concepts big data, real-time data challenges, open data portals, open standards, forecasting and predictions, quantified self, citizen science
- Human interaction & user-centric design co-creation design methods, visualization for decision support and decision making, evaluation methods, stakeholder- & requirement analysis, visualizations for experts vs. general public, energy games and gamification
We are accepting Short papers, up to 4 pages in 9-point ACM double-column format (i.e., excluding references) and unlimited number of pages for appendices and references, single-blind. The workshop proceedings will appear in the ACM Digital Library. The submission must be in PDF format and be formatted according to the official ACM Proceedings format. Papers that do not meet the size and formatting requirements may not be reviewed. Word and LaTeX templates are available on the ACM Publications Website. Submission implies the willingness of at least one author to register and present the paper at the workshop (due to COVID19 this will be a fully online event).
Papers should be submitted online.
Submission Deadline: April 23, 2021Author Notification: May 11, 2021Camera-ready submission: May 18, 2021, 23:59 AoE- Workshop: June 28, 2021, 1PM CEST
14 papers have been accepted for presentation and publication. Presentation order will be published shortly. All papers will be available via the ACM digital archive.
BBEMA: Dashboard for Baltic Balancing Energy Market Analysis V. Šakele, Z. Broka Riga Technical University
Data Visualisation for Remote Area Electrification Decision-Making: A Case Study of Indonesia A. Alshardy, S. Goodwin, A. Liebman Umm Al-Qura University and Monash University
Electrical Appliance Usage Timeline Data Visualization: Machinima and Dynamic Circle Z. Yang, N. Goddard, L. Webb, H. Chen The University of Edinburgh
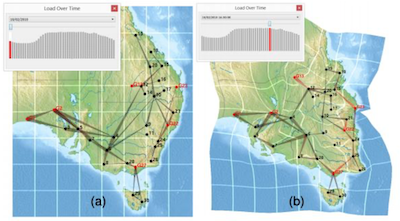
Informed Dashboard Designs for Microgrid Electricity Market Operators S. Goodwin, Y. Dkhissi, Q. Wu, B. Moyle, K. Freidin, A. Liebman Monash University and LGI Sustainable Innovation
Lumiphys: Designing a Long-Term Energy Physicalization to Democratize Smart Campus Data L. Morais, L. Sampaio, G. Yásser, A. Brito Université Paris-Saclay and Universidade Federal de Campina Grande
RAVIS: Resource Forecast and Ramp Visualization for Situational Awareness of Variable Renewable Generation P. Edwards, H. Sky, V. Krishnan National Renewable Energy Laboratory
Towards Embodied Data Storytelling for Energy Analytics in Immersive Environments A. Cunningham, J. Hart, U. Engelke, M. Adcock, B. Thomas University of South Australia and CSIRO Data61
Uncertainty Visualization for Renewable Energy Potential P. Diaz, K. Potter, G. Johnson, A. Lopez National Renewable Energy Laboratory
Visualising the Effect of COVID-19 on Electricity Consumptionin Victoria, Australia S. Chetty, H. Wang, S. Goodwin Monash University
Visualization of Jet Impingement and Ignition in a Piston-cylinder Chamber N. Brunhart-Lupo, S. Yellapantula, K. Gruchalla, R. Grout National Renewable Energy Laboratory
Visualization of Multi-Fidelity Approximations of Stochastic Economic Dispatch K. Panda, R. King, J. Maack, I. Satkauskas, K. Potter National Renewable Energy Laboratory
Visualizing Interactions Between Solar Photovoltaic Farms and the Atmospheric Boundary Layer T. Athawale, B. Stanislawski, S. Sane, C. Johnson Scientific Computing & Imaging (SCI) Institute
Visualizing Thermal Comfort in Residential Passive House Designs K. Vrotsou, W. Glad Linköping University
Visualizing Vehicle Acceleration and Braking Energy at Intersections along a Major Traffic Corridor H. Xu, A. Berres, C. Wang, T. LaClair, J. Sanyal Oak Ridge National Laboratory
- Sarah Goodwin Monash University, Australia
- Arnaud Prouzeau Inria Bordeaux, France
- Kenny Gruchalla National Renewable Energy Laboratory (NREL), USA
- Lyn Bartram Simon Fraser University, Canada
- Paul Cuffe University College of Dublin
- Johanna Fulda Clir Renewables Inc, Vancouver, BC, Canada
- Alex Godwin American University, Washington D.C.
- Maria Jesus Lobo Ecole Nationale de l'Aviation Civile
- Sebastian Meier Hafencity University
- Kristi Potter National Renewable Energy Laboratory (NREL)
- Jibonananda Sanyal Oak Ridge National Laboratory (ORNL)
- Darren Sharp Monash University
- Cagatay Turkay University of Warwick
- Jagoda Walny Canada Energy Regulator
- Bei Wang SCI Institute, University of Utah


